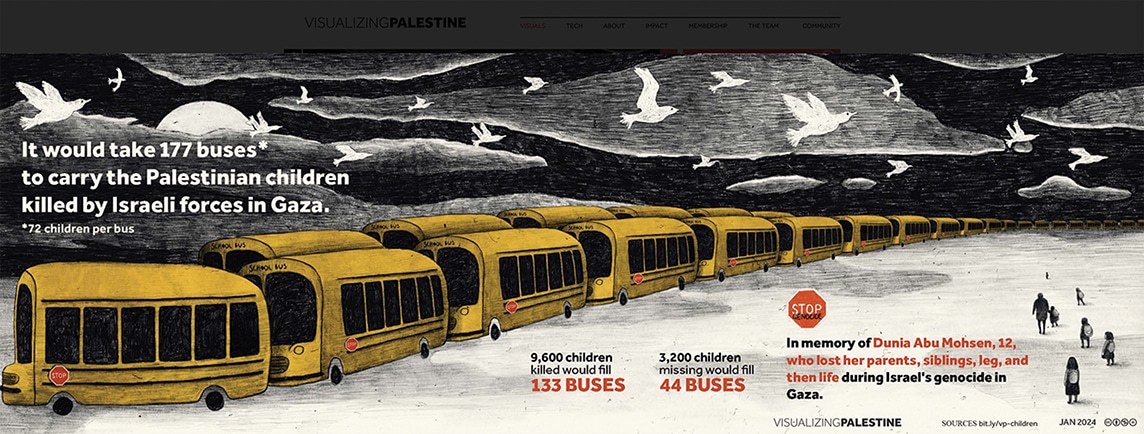
In the spring 2024 issue of Rethinking Schools, we recommended the valuable website of Visualizing Palestine, a nonprofit “dedicated to using data and research to visually communicate Palestinian experiences to provoke narrative change.” In line with this mission, Visualizing Palestine has drawn on material from their website and more to offer a graphic and student-friendly portrayal of Palestinian social reality in book form.
 Every page offers a visual story of life in Palestine and Israel. One water faucet graphic reveals the water inequality between Israel — 230 liters per person/per day — and Israeli genocide-stricken Gaza: three liters per person/per day. This, for people’s basic needs of hydration, cooking, and hygiene. Historical graphics illustrate instances of resistance, comparing hunger strikes in apartheid South Africa and apartheid Palestine-Israel. Not only do the illustrations in Visualizing Palestine teach students about the unequal and deadly relationship between Israel and Palestine, teachers can also use the graphics as prompts for students to create their own data-informed posters — about other countries or other eras. It is hard to overemphasize what a useful resource this book is. [Description by Rethinking Schools.]
ISBN: 9798888902509 | Haymarket Books





Twitter
Google plus
LinkedIn